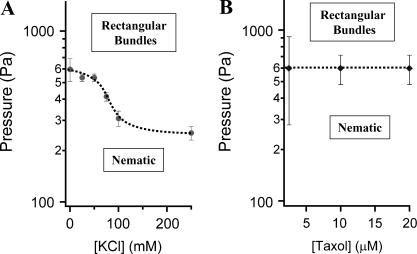
FIGURE 9.
(A) Pressure-KCl and (B) pressure-taxol phase diagrams, near the nematic-rectangular bundle phase boundary, for MTs with 20 k PEO. Dotted lines are guides to eye. The pressure required to form rectangular bundles decreases with increasing KCl concentration but is unaffected by taxol concentration.

