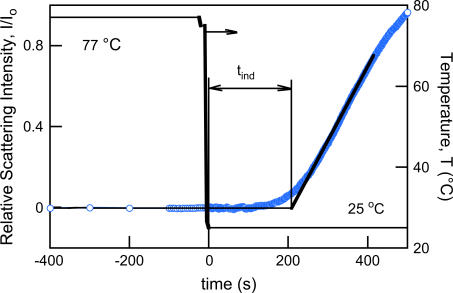
FIGURE 5.
Experimental measurement of the nucleation induction time (tind). The temperature ramp employed by using two temperature recirculation baths is shown by a solid line, whereas the relative scattering intensity at 90° as a function of time is depicted by open circles. Initial insulin concentration, Cin = 0.86 mg/mL; supersaturation, S = Cin/C* = 3.4.

