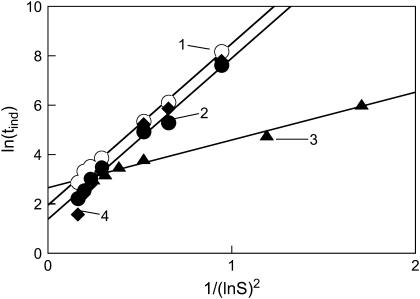
FIGURE 6.
Induction period (tind) as a function of supersaturation, plotted as ln(tind) versus 1/(ln S)2 (see Eq. 4). Open circles (trendline 1) represent data for the following conditions: NaCl, 0.7%; PEG 3350, 8.3%; pH 5.65; 25°C. Solid circles (trendline 2) show data for NaCl, 0.7%; PEG 3350, 16.6%; pH 5.65; 25°C. Triangles (trendline 3) depict data for NaCl, 0.7%; PEG 3350, 16.6%; pH 5.65; 37°C. Diamonds (trendline 4) show data for NaCl, 1.4%; PEG 3350, 16.6%; pH 5.65; 25°C. Initial temperature, 77°C. Solid lines are linear fits to the data (R2 > 0.986 in all cases).

