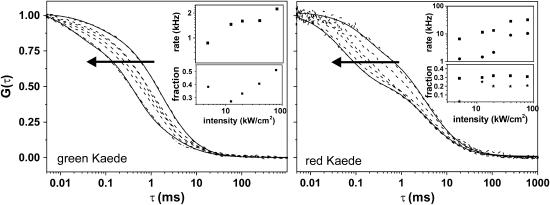
FIGURE 4.
Dependence of the excitation intensity on the autocorrelation curves obtained for grKaede (left) and rKaede proteins (right). Solid lines represent fits according to Eqs. 2a and 2b. The applied excitation intensities in the direction of the arrow were 2.5, 4.9, 12.4, 19.6, 39.1, and 78.0 kW/cm2. The transition rates and fractions for the blinking reaction are given in the insets (transition rates τ1 (squares) and τ2 (stars, right inset) and fractions F1 (squares) and F2 (stars, right inset)).

