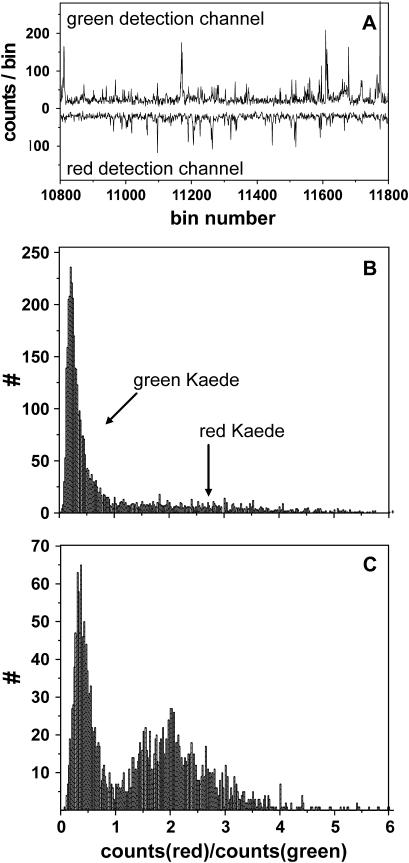
FIGURE 5.
Single-molecule detection in a microfluidic channel. (A) Out of the fluorescence trace of the green and red detection channel, the fluorescence bursts above a set threshold (50 kHz) are analyzed. Histograms of the bursts for low (B) and high (C) intensity of the initiation laser (0.07 and 427 kW/cm2 at 405 nm). The ratio of red to green intensity per burst corresponds to the color of detected protein. For grKaede, Ired/Igreen < 1; for rKaede, Ired/Igreen > 1.

