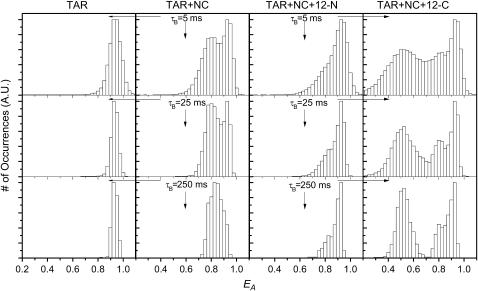
FIGURE 1.
Ensemble EA values of doubly labeled TAR DNA at three different τB under different reaction conditions are shown. (Column 1) EA histogram before the addition of NC. (Column 2) EA histogram after addition of 445 nM NC. (Column 3) EA in the presence of 445 nM NC and 100 nM noncomplementary 12-N oligomer. (Column 4) EA in the presence of 445 nM NC and 100 nM complementary 12-C oligomer. All experiments were performed at 2 mM Mg2+.

