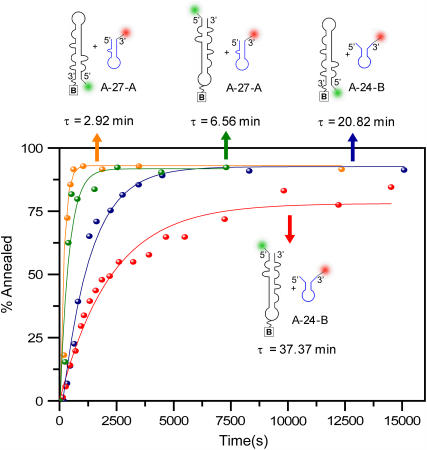
FIGURE 4.
Kinetic curves for the annealing rates of the zipper mimic, A-27-A, versus the kissing mimic, A-24-B, with donor-labeled TAR DNA. These experiments were performed in the presence of 445 nM NC and 2 mM Mg2+. The oligonucleotide concentrations were 10 nM in both cases. Analogous reactions with inverted donor-labeled TAR DNA are also included in the figure.

