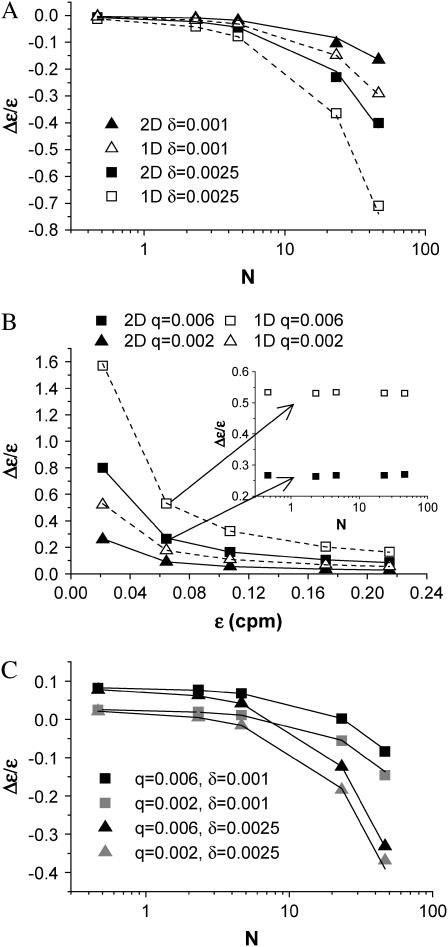
FIGURE 3.
Relative error in brightness introduced by non-ideal detector effects. The PCH functions are modeled for identical parameters in both channels, i.e., ɛA = ɛB = ɛ. This simplifies the comparison with single-channel data. (A) The relative error of ɛ due to deadtime is shown for dual-channel (solid symbols) and single-channel (open symbols) histograms as a function of  for two different deadtime parameters. (B) The relative error of ɛ due to afterpulsing is shown for dual-channel (solid symbols) and single-channel (open symbols) histograms as a function of ɛ for two different afterpulse probabilities. The relative error in ɛ as a function of
  for select values of ɛ is shown as an inset. (C) The relative error of ɛ due to the combined effects of afterpulsing and deadtime is shown for dual-channel histograms as a function of
  We used ɛ = 0.21 cpm in A and C, while we set
  in B. The solid and dashed lines are the predictions of the relative error of ɛ based on moment analysis.

