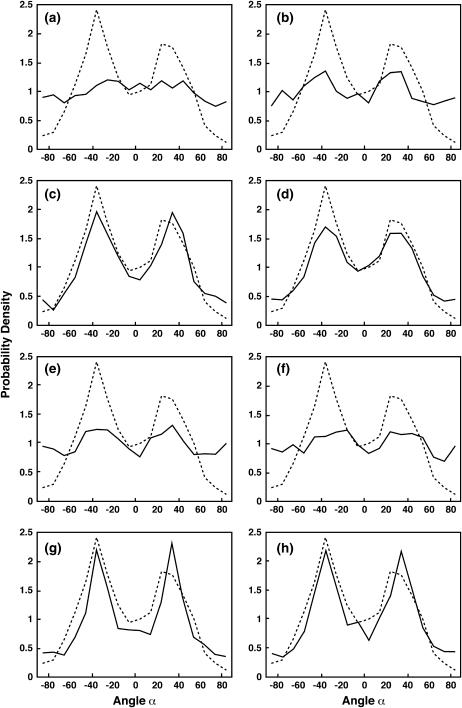
FIGURE 8.
The probability distribution, P(α), for growing actin filaments in the lamellipodium. The dashed line is the experimental data from Maly and Borisy (11), which shows the histogram of α with respect to the normal of the leading edge. The angle α is computed from the projection of the filaments in the xy plane. The distributions are normalized. The solid lines are the results from our simulations. (a) Case 1: no geometrical restriction on the values of θ and φ. Arp2/3 branching occurs with the rate kb in a region 50-nm from the leading edge. (b) Case 1: no restriction on θ, φ, and ω, but branching occurs directly underneath the membrane, i.e., within 5 nm. (c and d) Two successful examples from Case 2. (e and f) Two failed examples from Case 2. See Table 1 for the values of θ0, φ0, Δθ, and Δφ. (g and h) Case 3: θ0 = 45°, φ0 = 45°, and ω is constrained. ω0 = ±90° and Δω = 45°. (g) Δθ = Δφ = 45°. (h) Δθ = Δφ = 90°. We see that agreement between simulation and experiment is achieved in c–f. The detailed description of these panels are given in the text.

