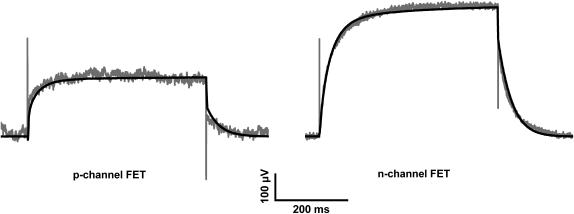
FIGURE 10.
Comparison of recorded (gray traces) and calculated FET signals (black traces) for a p-channel FET (left panel) and an n-channel FET device (right panel). Each calculated trace represents the sum of the respective PSpice simulation VJ and the additional component Vis due to the ion sensitivity of the FETs. (Left panel) PSpice simulation and results from the spatial integration for the p-channel FET experiment of Fig. 7. Parameters used are: R = 19 μm, h = 28 nm, SFET = 0.7 mV/pK. (Right panel) PSpice simulation and results from the spatial integration for the n-channel FET experiment of Fig. 7. Parameters used are: R = 19 μm, h = 39 nm, SFET = 1.62 mV/pK.

