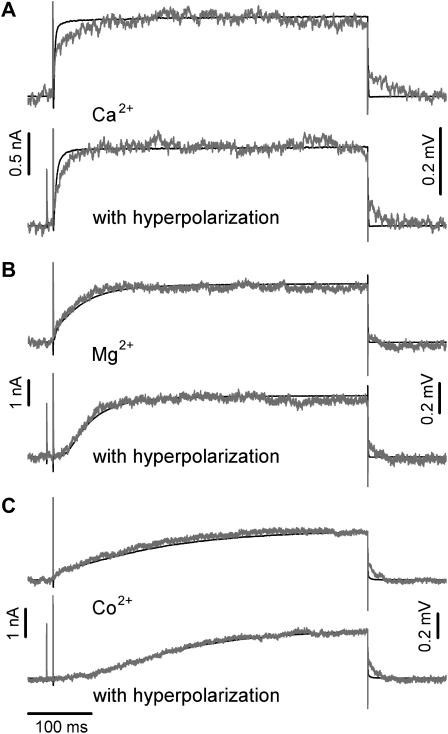
FIGURE 3.
Comparison of whole-cell membrane currents and p-channel FET signals (VFET) for different electrolyte solutions with and without a hyperpolarizing prepulse. (A) Ca2+ solution, time course of IM (black traces) and the corresponding averaged VFET (n = 50) (gray traces). (B) Mg2+ solution and (C) Co2+ solution. The recordings with a hyperpolarizing prepulse are indicated.

