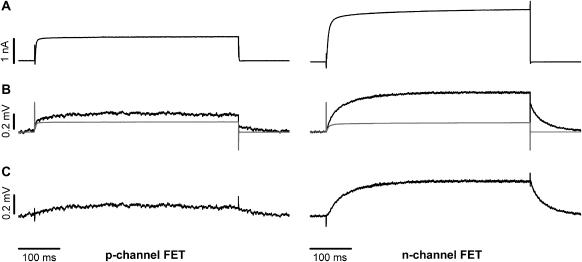
FIGURE 7.
Comparison of whole-cell membrane currents (IM) and FET signals (VFET) recorded with a p-channel FET (left panels) and an n-channel FET (right panels). (A) Whole-cell current. (B) Comparison of averaged VFET signals (gray traces) and simulated VJ (black traces). The steady-state ratio VJ/VFET was 60% for the p-channel FET and 25% for the n-channel FET. (C) Difference between recorded and simulated FET signals (VFET − VJ).

