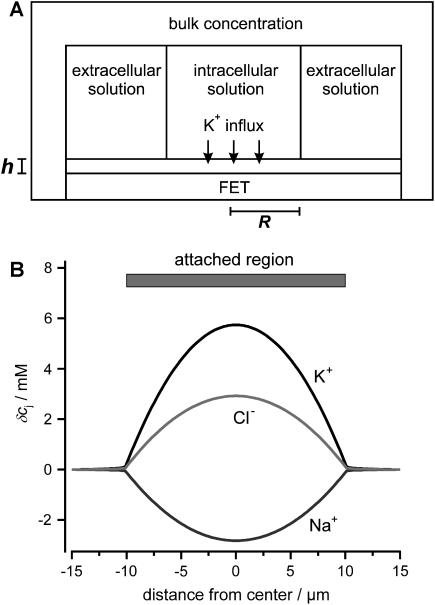
FIGURE 8.
Concentration changes in the attached region. (A) Geometry used for the numerical integration. (B) Profile of the change in ion concentration (δcj) after a 100-ms step injection of K+ into the cleft. The following parameters were used for the calculations: cellular holding voltage Vh = +50 mV, whole cell K+ current IM = 2 nA, R = 10 μm, h = 50 nm, ratio 2:1 of free/attached membrane, bulk concentrations: [K+] = 5 mM, [Na+] = 140 mM, [Cl−] = 145 mM.

