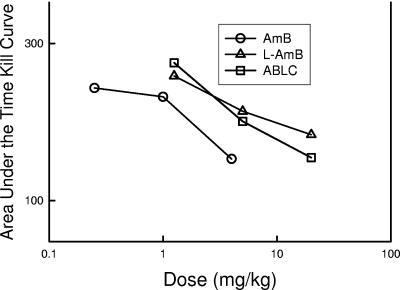
FIG. 3.
Calculated area under the time-kill curve for activity against C. albicans in neutropenic mice following the administration of AMB, L-AMB, and ABLC at single doses of 0.25, 1, and 4 mg/kg of AMB and 1.25, 5, and 20 mg/kg of L-AMB and ABLC. Each symbol represents the area under the time-kill curve for a dose level calculated by using the trapezoidal rule.

