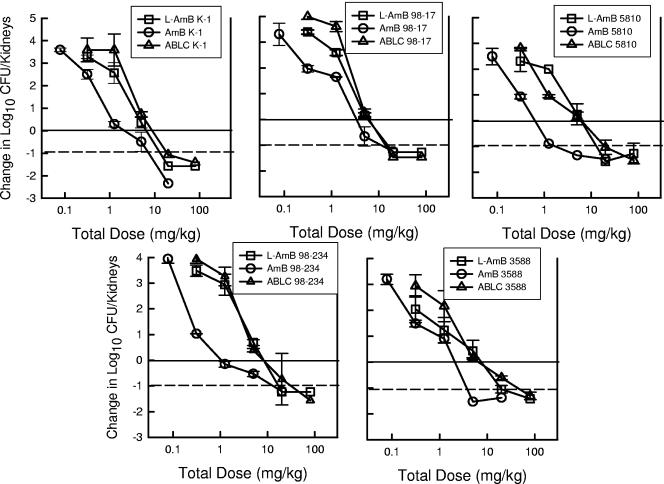
FIG. 4.
Relationship between the 24-h total dose (mg/kg/24 h) and the change in the log10 CFU/kidneys relative to the organism burden at the start of therapy for AMB, L-AMB, and ABLC against five Candida isolates in neutropenic mice. Each symbol represents data from two mice. The solid horizontal line represents the burden of organisms at the start of therapy. The dashed horizontal line represents a 1-log10 reduction in organism burden in kidneys.

