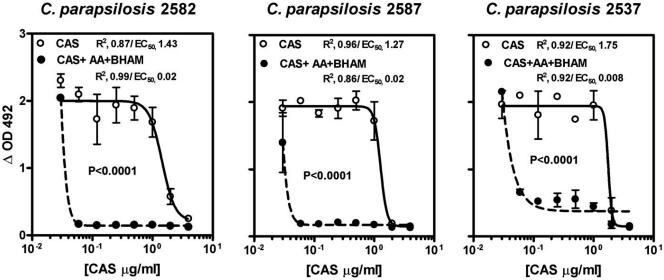
FIG. 2.
XTT-based analysis of in vitro activities of CAS alone (solid lines) and of CAS in combination with the mitochondrial inhibitors AA and BHAM at standard concentrations (2 μM and 4 mM, respectively; dotted lines) in RPMI medium against three clinical isolates of C. parapsilosis. Sigmoid concentration inhibitory-effect curves were generated by fitting data to a four-parameter logistic regression model (Hill equation). The symbols represent the means ± standard deviations from experiments performed in triplicate in each case. ΔOD492, optical density at 492 mm.

