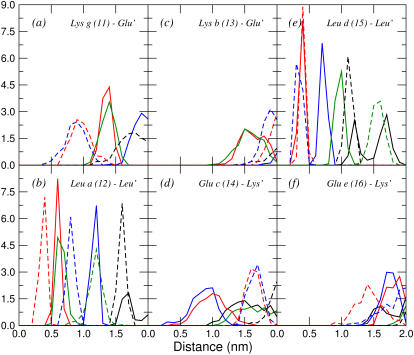
FIGURE 4.
Distributions of minimum distances from the six central residues of the first helix (11–16) to the residues of the second helix with which they are expected to interact, calculated from the last 5 ns of trajectory aB2. The label in each plot specifies the name and position of the residue taken as the reference in the first helix and the residues of the second helix (primed) to which the minimum distances are calculated. Black, blue, red, and green curves represent residues from the first, second, third, and fourth turns, respectively, of the second peptide. Solid lines represent glutamates at position e′, leucines at position d′, or lysines at position g′, and dashed lines represent glutamates at position c′, leucines at position a′, or lysines at position b′, depending on the case. For glutamate and lysine residues, only the charged groups (COO− and  ) were considered. Minimum distances between atoms in the aliphatic chains should be reduced by ∼0.1 nm due to the treatment of the nonpolar hydrogens as united atoms.

