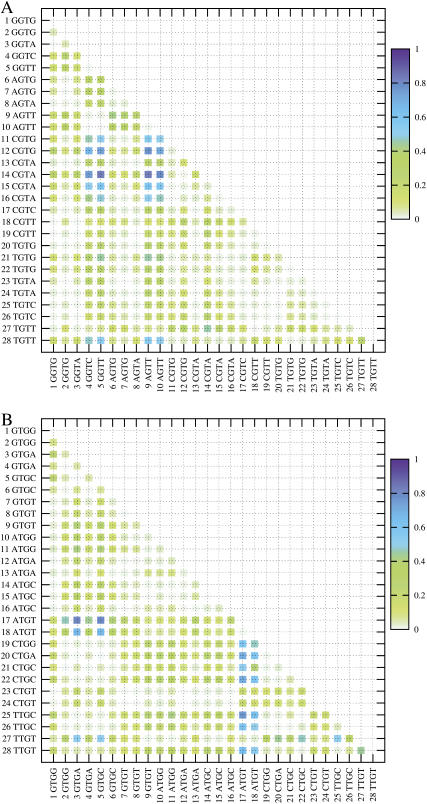
FIGURE 10.
2D matrix plot showing DKL between all pairs of the dinucleotides with different flanking sequences. (A) The central dinucleotide is GT. (B) The central dinucleotide is TG. The light green shades indicate low DKL and hence similar structures, and the shades of blue indicate differences in structure. Data from only states 1 and 7 were used in this plot.

