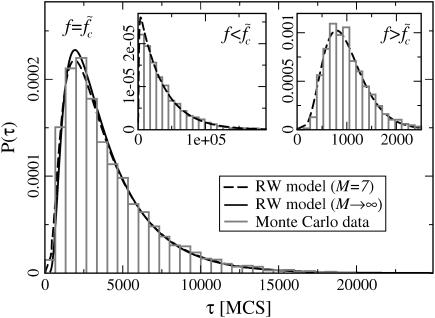
FIGURE 5.
Waiting time distributions. (Main panel) The histogram of waiting times τw of a 120-bp-long DNA sequence with M = 7 equidistant mutations subject to a force  is well described by the distribution of collision times (dashed line) of the two-random-walker model (see main text and Fig. 6). The solid line shows the parameter-free asymptotic distribution of Eq. 5 for comparison. (Insets) Distribution of τw for forces above and below
  (f = 15.2 pN and f = 11.4 pN, respectively). The dashed lines are fits using the RW model with directional bias (see main text).

