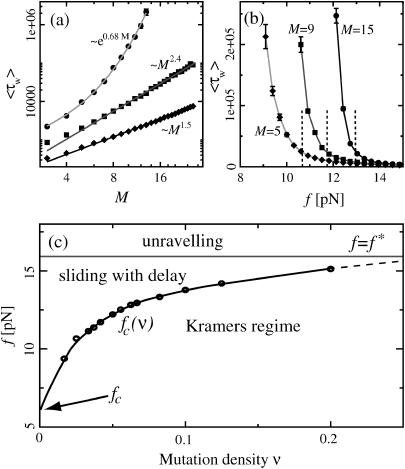
FIGURE 7.
(a) The mean waiting time 〈τw〉 as a function of the system size (the mutation density of ν = 1/15 is kept fixed as the number of evenly spaced mutations M is increased). At low forces the scaling is exponential (circles, data for f = 11.4 pN; solid line, exponential fit), while we find power-law behavior at the force threshold ( = 12.9 pN, squares) and above (f = 15.2 pN, diamonds). (b) The mean waiting time as a function of the applied force for a sequence of N = 240 bp with 5, 9, and 15 mutations. The dashed lines indicate the threshold force
  for each case. Below the threshold, 〈τw〉 rises sharply. (c) Different regimes of the DNA dynamics in the parameter space (f, ν). The Kramers regime (DNA rupture becomes exponentially slow with increasing system size) is separated from the (delayed) sliding regime by the line
  where the inward and outward hopping rates are equal, kin = kout (circles, data; solid line, interpolation). At forces larger than f*, the molecule dissociates by unraveling from both ends.

