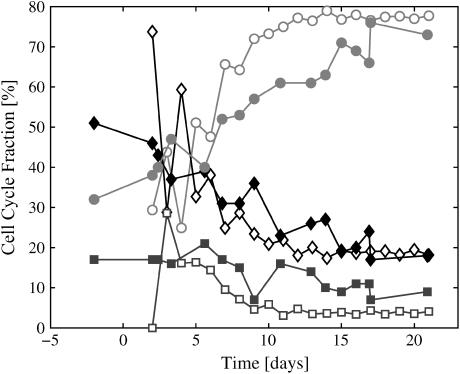
FIGURE 6.
Cell-cycle fraction as a function of time with 0.08 mM O2 and 5.5 mM glucose in the medium. Solid symbols are experimental measurements from the EMT6/Ro cell line; open symbols are the corresponding simulation. (Red lines indicate G1-phase, black lines indicate S-phase, and blue lines indicate the G2-phase.)

