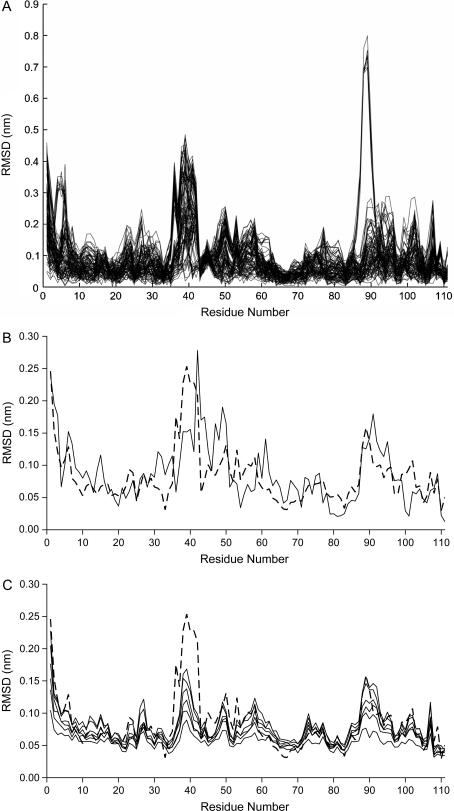
FIGURE 3.
(A) All combinations (100) of C-α RMSD between oxidized and reduced states obtained in the last 2 ns of the trajectories (average structures). (B) Average C-α RMSD between oxidized and reduced states (the average of all curves in Fig. 3 A) (dashed line). The same measure obtained for the difference between the experimental oxidized and reduced structures is also presented (solid lines). (C) The same measure as in the dashed line of Fig. 3 B, but with average RMSDs calculated from the short simulations, showing the evolution of the conformational changes. The curve obtained with the long simulations is depicted (dashed line), whereas measurements after 2, 4, 6, 10, 30, and 50 ps are presented (solid lines).

