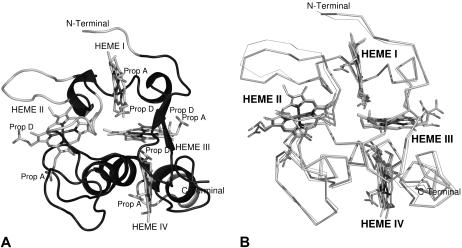
FIGURE 4.
(A) Three-dimensional fold of tetraheme cytochrome c3. The variable regions are colored in gray (and correspond to residues 1–3, 36–42, and 88–93) and the invariant ones are colored in black. The variable zones correspond to residues with RMSD higher than 0.07 nm. The protein is rendered as a cartoon and the hemes are represents with sticks. (B) Comparison between the average oxidized (thick lines) and reduced (thin lines) structures, obtained in the last 2 ns of all replicas. Figures generated with the program Pymol (55).

