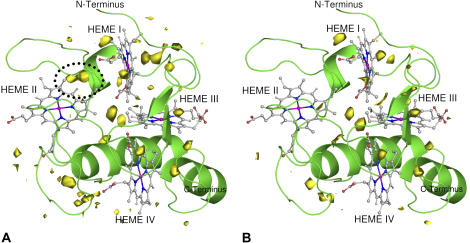
FIGURE 8.
Graphical representation of the average WPDF in the oxidized (A) and reduced (B) structures, with respect to the oxidized (A) and to the reduced replicates (B). The protein structure is rendered as a cartoon and the WPDF is represented as a yellow contour. A zone where differences are higher is encircled in the figure of the oxidized state (A) by a dotted line. The contour level for the WPDF is a probability of 0.18. The WPDF is an average calculated for all replicates over the last 2 ns of the dynamics. Figure generated with the program PyMOL (55).

