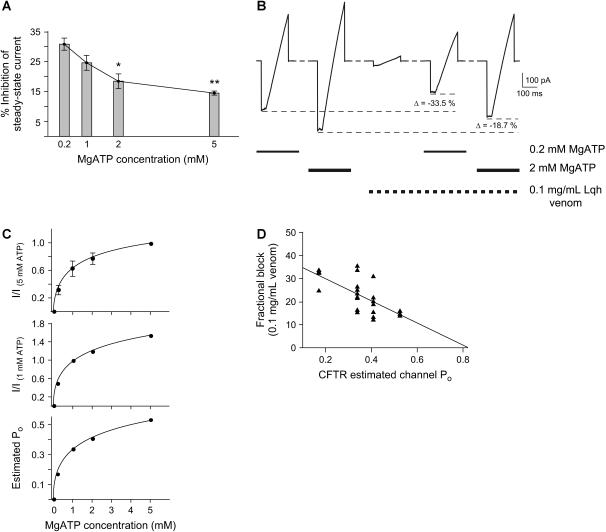
FIGURE 3.
Altering MgATP concentration and channel activity affects the inhibitory potency of venom. (A) Fractional inhibition of mean steady-state current in the presence of 0.1 mg/mL Lqh-pf venom with four concentrations of MgATP. Experiments performed were similar to those shown in Fig. 1 A. Mean WT-CFTR steady-state current was determined by averaging the current over the final 15–20 s at each condition. Columns and error bars indicate mean ± SE of n = 4–10 observations for each condition. The asterisks indicate values that are significantly different from those recorded with 0.2 mM MgATP (*p ≤ 0.01, **p ≤ 0.001). (B) Representative current from voltage ramps in a single excised, inside-out macropatch containing WT-CFTR, at two [MgATP]. Bath solution contained no MgATP, 0.2–2 mM MgATP, 0.1 mg/mL Lqh-pf venom, or 0.2–2 mM MgATP plus 0.1 mg/mL Lqh-pf venom, and was changed in ∼25 ms by a rapid perfusion apparatus. CFTR channels were phosphorylated before the beginning of the experiment. All measurements were made using voltage ramps where the membrane potential was stepped from 0 mV to −100 mV and held for 50 ms before being ramped to +100 mV over 150 ms. Voltage ramps were recorded every 2 min. The peak inward current recorded in each condition is indicated by a dashed line and was used to determine the amount of inhibition. Lowering the [MgATP], leading to decreased CFTR activity, resulted in an increase in inhibitory potency of the venom. (C) Calculation of estimated Po for macropatch experiments as a function of [MgATP]. (Top) The dose-response relationship between [MgATP] and macroscopic CFTR current normalized to the macroscopic current measured at 5 mM MgATP. All measurements were made in excised, inside-out macropatches using voltage ramps where the membrane potential was stepped from 0 mV to −100 mV and held for 50 ms before being ramped to +100 mV over 150 ms. Only currents measured at Vm = −100 mV were used in this analysis. Bath solution contained 0.2–5 mM MgATP, and was changed by a rapid perfusion apparatus. CFTR channels were phosphorylated before the beginning of the experiment. (Middle) CFTR macroscopic currents normalized to current with 1 mM MgATP. (Bottom) Estimated CFTR Po calculated from the values obtained after normalization of macroscopic currents to 1 mM MgATP, where Po under control conditions was 0.339 ± 0.029 (n = 51). (D) Correlation between fractional block by 0.1 mg/mL Lqh-pf venom and CFTR estimated channel Po. The plot includes macropatch recordings of WT-CFTR at four [MgATP]. The line indicates fit of the data by linear regression (p ≤ 0.001, R2 = 0.45).

