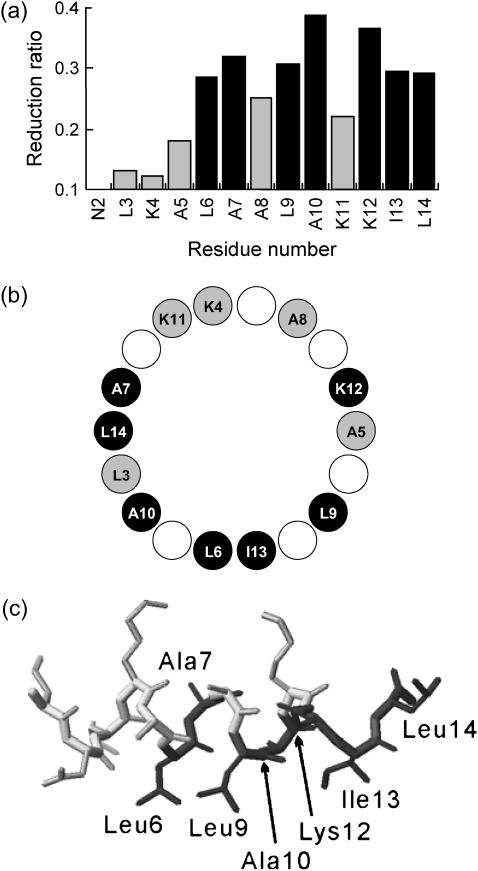
FIGURE 5.
Overview and results of the CS experiment. (a) Plots of the intensity reduction ratios of the signal intensities with and without the irradiation of the lipid. The residues with signal intensity reduction ratios of >0.28 are shown in black. (b) The helical wheel representation of mastoparan (Leu3–Leu14). The residues with signal intensity reduction ratios of >0.28 are shown in black circles. (c) Solution structure of mastoparan with detergent micelles (Protein Data Bank entry 1D7N; (24)). The residues that were affected by the irradiation are shown in black.

