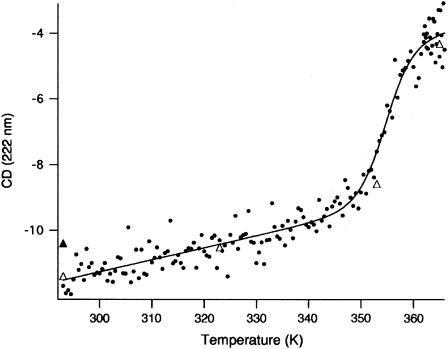
FIGURE 2.
Thermal denaturation of Aplysia metMbCN as a function of temperature in the range 20–92°C (293–365 K) in 100 mM phosphate pH 8.1 and 2 mM NaCN. The graph shows the CD data at 222 nm recorded at 1° intervals on a 4-μM protein solution (light path = 0.1 cm). The open triangles on the main graph are points recorded at single temperature values after equilibrating the protein solution for 10 min. The solid triangle indicates the value corresponding to a protein solution kept at 92°C for 10 min and slowly cooled down to 20°C. The continuous line is a fit to Eq. 4.

