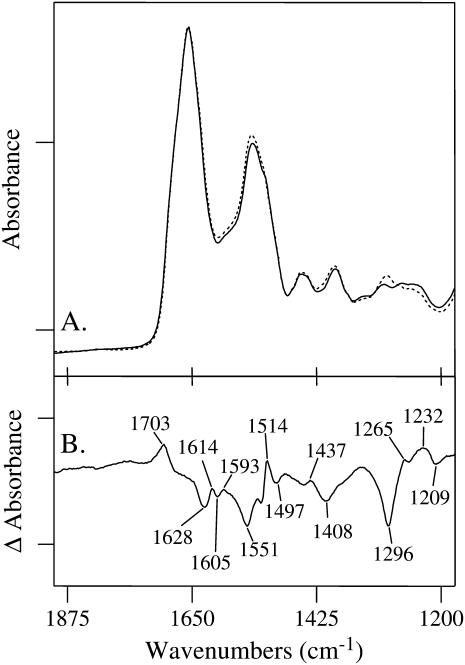
FIGURE 3.
Infrared absorption spectra of (A, solid line) unlabeled human wild-type MnSOD, and (A, dotted line) wild-type MnSOD in which each tyrosine residue is labeled with fluorine at the 3-position of the phenol ring. The tick marks on the y axis represent 0.2 absorbance units. The difference spectrum (unlabeled-minus-fluorinated) is shown in B. The tick marks on the y axis represent 0.03 absorbance units. FTIR data were acquired at 20°C on 30 μL of protein sample at 0.5 mM in 20 mM phosphate buffer at pH 7.8 and partially dehydrated onto a ZnSe window.

