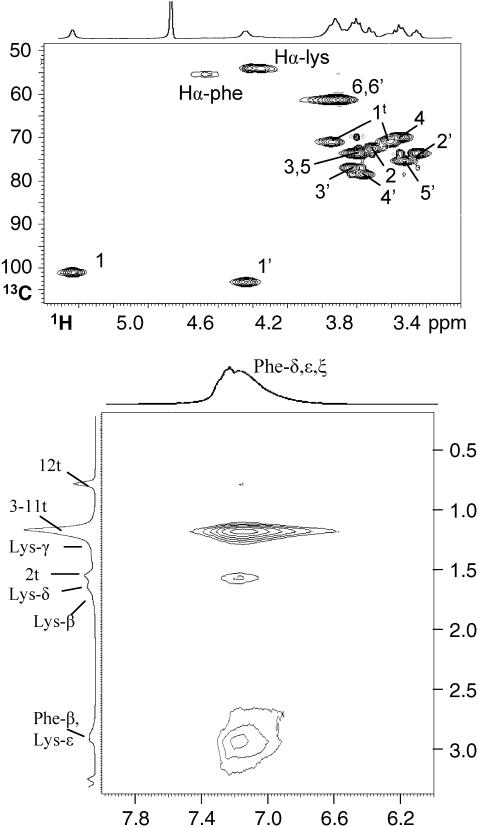
FIGURE 11.
Expansions of the 2D 1H-13C HSQC spectrum (top) and the 2D 1H NOESY spectrum, using a mixing time of 15 ms (bottom), of a mixture of 80 mM (KF)n and 40 mM β-C12G2 solution in 20 mM deuterated acetate buffer, pD 5. For peptides, all concentrations are given as the amino acid residue concentrations. The atom-specific assignment is indicated with the numbering presented in Fig. 12. The NOESY spectrum shows NOE crosspeaks between the aromatic ring protons of the phenylalanine residues and the protons in the aliphatic hydrocarbon chain of β-C12G2. Atom-specific assignments of the 1H peaks are presented in the corresponding regions of the 1D 1H spectrum displayed along the edges of the 2D spectrum.

