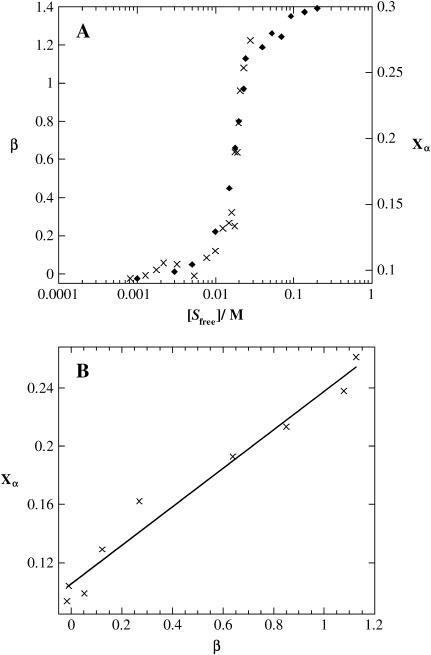
FIGURE 13.
(A) Number of bound β-C8G1 molecules per (KF)n monomers (β, ×) as determined by equilibrium dialysis and the fraction of (KF)n in α-helix conformation (Xα, ♦; determined by CD spectroscopy) as a function of free β-C8G1 concentration [Sfree]. (B) The number of bound β-C8G1 molecules per (KF)n amino acid monomers (β) as a function of the fraction of (KF)n in α-helix conformation (Xα) plotted for the same free β-C8G1 concentration.

