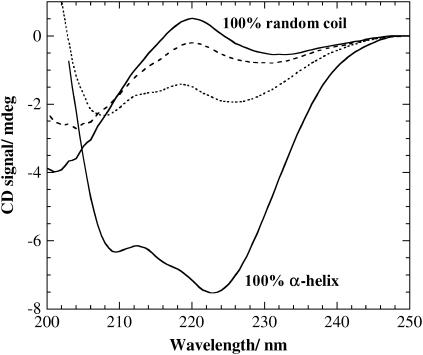
FIGURE 2.
CD spectra for (KF)n with (dotted trace) and without (dashed trace) addition of 0.2 M β-C8G1. The reference spectra for 100% α-helix and 100% random coil (solid traces) are given for comparison. A (KF)n concentration of 25 μg/ml (which equals 0.14 mM of amino acid residues) was used in the CD measurements. All measurements were performed in a 20-mM acetate buffer at pH 4.9.

