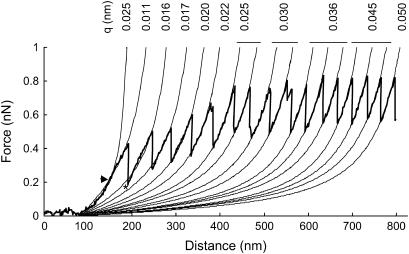
FIGURE 4.
Saw-tooth force versus distance retraction curve for a single bridged adhesive nanofiber with the WLC model fitted to each peak within the curve. The model is fitted from the point at which the retraction curves rise above zero deflection. The persistence length (q) for each of the WLC model curves is given. There are two WLC model fits to the first peak because the slope of the first peak changes at the point shown by the arrowhead, the initial rising part (up to the arrowhead) fits well with a persistence length (q) of 0.025 nm whereas the peak itself (above the arrowhead) fits well to 0.011 nm. The asterisk shows where the WLC model fits weakly to the second peak in the curve; in later peaks the fit is accurate. Curves recorded at 0.8 μm/s on a mucilage pad of the marine diatom, T. undulatum.

