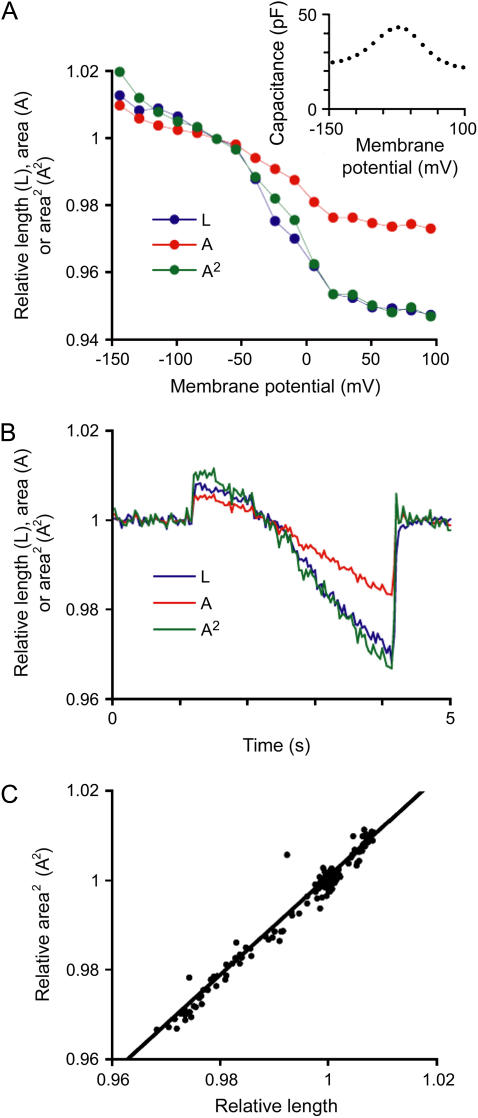
FIGURE 3.
Prestin-dependent motility. (A) Relative length (L, blue), longitudinal section area (A, red), and estimated prestin-dependent length changes calculated from the area values (A2, green) in one representative OHC that underwent square pulse stimulations. The 10 OHCs tested in this experiment showed similar responses. Values were normalized to those during VH = −70 mV and plotted against VH. Note that actual L changes fitted very well with predicted area-triggered length changes (A2). (Inset) Voltage-sensitive nonlinear capacitance measured in this cell. (B) Experiments with ramp stimulation. Again, as shown in the response of one representative OHC out of four tested, actual L changes fitted very well with predicted area-triggered length changes (A2). No differences were evident in the response of the four tested OHCs. (C) The plot of voltage-induced length changes (x axis) to the square value of voltage-induced area changes (A2, y axis) in the same representative cell described in panel B. The values were very similar (y ≈ ξ). Fitting parameters are: y = 1.1x − 0.09, R2 = 0.97.

