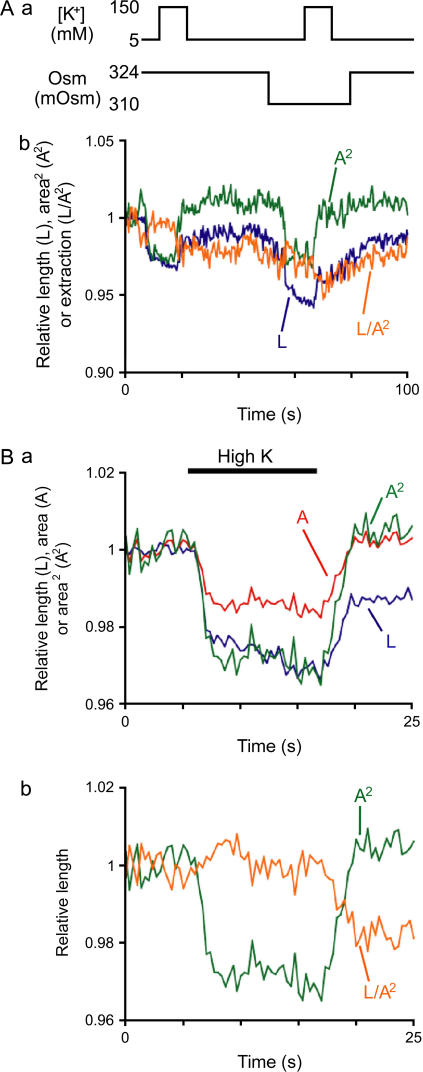
FIGURE 5.
Extraction of prestin-dependent and prestin-independent components. (A, a) Experimental protocol. OHCs were perfused with solutions that differed in K+ concentration, osmolarity, or both. (A, b) Relative length (L, blue), prestin-dependent length change (A2, green) and prestin-independent length change (L/A2, orange) of one representative OHC. No significant differences in response were observed between the 10 tested OHCs. (B) Relative values of L (blue), A (red), and A2 (green) obtained from four cells during high K+-induced OHC contraction. L and A were normalized to the averaged values during the first 5 s of the recording. (C) Extraction of prestin-dependent and prestin-independent component from the observed L trace in panel B.

