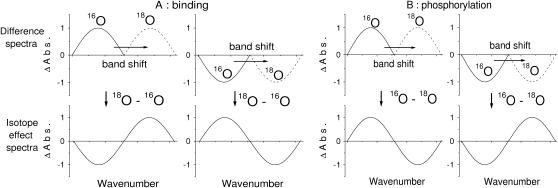
SCHEME 3.
Illustration of the band shifts in the difference spectra upon isotopic labeling (top panels) and in the IE spectra (bottom panels). The wavenumber scale runs according to convention from high wavenumbers on the left-hand side to low wavenumbers on the right-hand side. Illustrated are downshifts of positive and negative bands upon isotopic labeling. (A) Binding spectra and IE binding spectra, with downshift of a positive band, characteristic of bound ATP (left), and downshift of a negative band, characteristic of free ATP (right). (B) Phosphorylation and IE phosphorylation spectra, with shift of a positive band, characteristic of the phosphoenzyme phosphate or ADP (left), and shift of a negative band, characteristic of bound ATP (right). Note that the sign convention in IE binding and IE phosphorylation spectra is different, to obtain the same band profile for band shifts of bound ATP.

