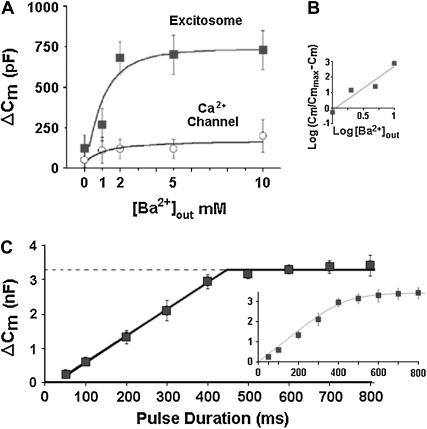
FIGURE 4.
Quantitative characterization of reconstituted depolarization-induced exocytosis. (A) Dependence of depolarization-induced ΔCm on extracellular Ba2+ concentration. Depolarization from −80 mV to 0 mV for 2 × 500 ms 100 ms apart in oocytes expressing Lc-type channel without (lower trace) or with (upper trace) the synaptic proteins syntaxin 1A, SNAP-25, and synaptotagmin I, as in Fig. 1. (B) Hill plot. Data (from A) show saturation of the Cm effect >2 mM, and a nonlinear concentration-dependence of ΔCm with an estimated Hill coefficient of nH ≈ 2.8. (C) Dependence of depolarization-induced ΔCm on depolarization duration. Depolarization from −80 mV to 0 mV for indicated times in 5 mM Ba2+. A linear correlation observed with pulse duration for longer depolarization periods, saturation at ∼400 ms and half-maximal capacitance changes are reached at a depolarization time of ∼250 ms. A straight line fitted to the data between 50 and 400 ms had a slope of 7.7 pF ms−1 (R2 = 0.998) corresponding to ∼600,000 vesicles at saturation. The results could be fitted less well with a single exponent (inset) showing a time constant of 101.05 ± 12 ms corresponding to an initial rate of 6 × 10⁶ vesicles/s (inset). The saturation in the capacitance jumps defines a readily releasable pool of ∼106–107 vesicles (see 31).

