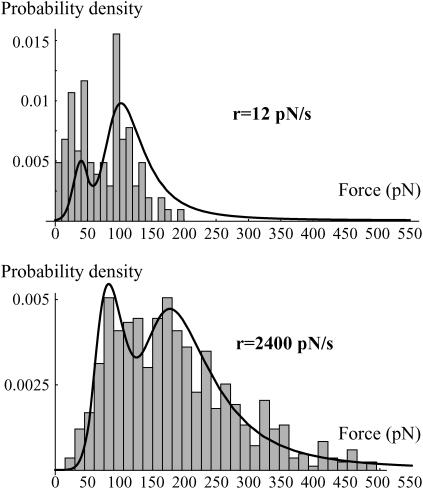
FIGURE 6.
Experimental distributions of the rupture force obtained with the DNA coated beads for two loading rates: 12 pN/s and 2400 pN/s. The corresponding probability density of the rupture forces predicted from the energy landscape given in Fig. 4 and Kramers' equations (Eq. 6a–e) is superimposed. The initial conditions are P1(0) = λ, P2(0) = 1–λ, and P3(0) = 0. Because of small variations in the experiments, λ had to be adjusted with the loading rate. Here, λ = 0.3 for 12 pN/s and 0.6 for 2400 pN/s. Nevertheless, it was always of the order of 0.5. The fit at 12 pN/s is not perfect because of the presence of nonspecific forces that slightly merge with the first peak and artificially decrease the height of the second one after normalization. The experimental error, σ(f), is the same as that used in Fig. 5.

