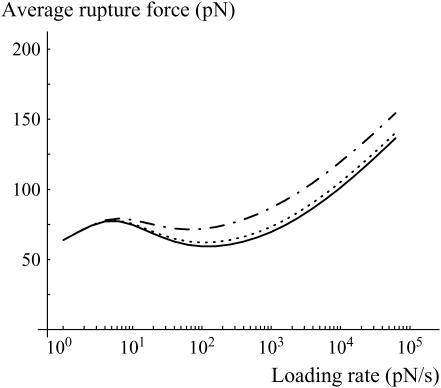
FIGURE 9.
Average rupture force as a function of the loading rate for a bond that is given 0, 100, or 500 ms before any pulling force is applied (respectively solid, dotted, and dash-dotted lines). Three regimes are observed: 1), Above typically 100 pN/s, the bond is in the second metastable state, the average rupture force increases with the loading rate and the rupture force distributions are the ones given in Fig. 3. 2), Between 5 and 100 pN/s, the lifetime of the bond is longer, more time is given to reach the most favorable state, and therefore, the average rupture force decreases with increasing loading rate. 3), Below 5 pN/s, the bond always reaches the most stable state during the pulling phase; the intermediary metastable state is never observed.

