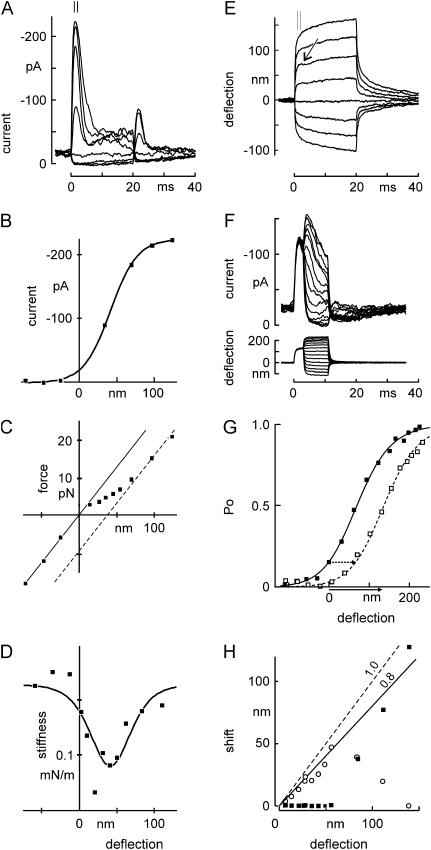
FIGURE 2.
Mechanical and electrical responses to a family of force steps. (A) Receptor current elicited by deflection of a hair bundle with the optical trap. The receptor current showed a rapid activation for positive deflections, followed by a fast (∼5-ms) phase of adaptation. A second phase of slower adaptation was apparent with longer stimuli. Negative deflections also produced adaptation, as shown by a rebound transient current upon termination. Inward current is shown as upwards. (B) Peak receptor current as a function of deflection. The current was averaged from 1.0 to 2.0 ms after deflection (indicated by bars in A). Deflections were measured from E during the same time interval. The smooth curve is a first-order Boltzmann relation with midpoint at 41 nm and steepness of 18 nm. (C) Force versus deflection, with force measured at the peak of the receptor current. Deflections are from E, and forces were calculated from the deviation between bead position and trap center. Note that the figure has axes reversed from Fig. 1, A–C, top, but illustrates the same phenomena. Consistent with the gating-spring model of transduction, the “instantaneous” F(X) relation lies between two lines of the same slope, corresponding to transduction channels all closed (solid line) or all open (dotted line). (D) Instantaneous stiffness of the bundle as a function of bundle deflection. The stiffness (calculated by stepwise differentiating the force with respect to displacement in C) showed the characteristic dip near the center of the I(X) curve due to gating compliance. The curve is the derivative of a fit by eye to the data in C. (E) Bundle movement with two phases. The bundle movement corresponding to A showed a fast (0.2-ms) deflection followed by a slow relaxation for large deflections. For small positive deflections, an additional small and rapid negative movement occurred at the same timescale (2–4 ms) as the fast phase of adaptation (arrow). (F) Stimulus protocol to test the mechanism of fast adaptation. An adapting step of 130 nm was presented for 3 ms and followed by test steps of amplitudes between −112 and + 226 nm. A different cell is depicted from that of A–E. (G) I(X) curves measured with (open symbols, data from F) or without (solid symbols, data not shown) a 3-ms adapting step of 130 nm. The solid line is a fit by eye to the resting I(X) curve; the dashed line is the same but shifted to the right by 67 nm. (H) Amplitudes of fast and slow adaptation with increasing deflection, in a third cell. Adaptation was measured as an inferred shift with time (calculated from the receptor current and the measured I(X) relation), and the shift with time was fitted with a double exponential relation. The fast phase of I(X) shift (○) showed near-complete adaptation for small steps but declined for larger steps, whereas the slower phase (▪) was negligible for small steps, and rose to ∼80% for larger steps.

