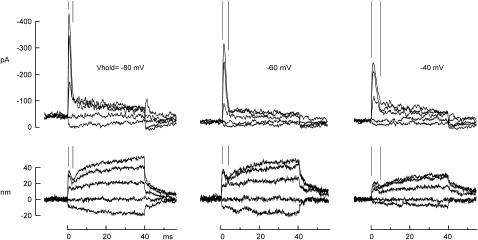
FIGURE 6.
Kinetics of fast adaptation and the twitch. Ca2+ influx was reduced by a change in membrane potential delivered 30 ms before a force step. The time course of fast adaptation (indicated by parallel lines) matched that of the negative-going twitch. Both slowed at more positive potentials by a similar amount. 4 mM Ca2+ external solution.

