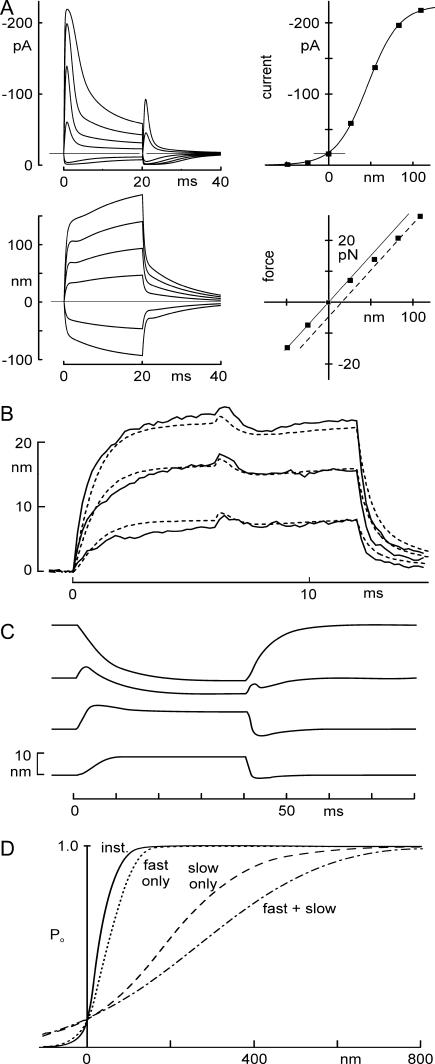
FIGURE 8.
Predictions of receptor current and bundle motion for a model in which Ca2+ changes Po(F). (A) Currents and bundle displacements in response to a family of optical trap displacements predicted using the mechanical model, with parameters from Fig. 2. It included a Ca2+-dependent channel closure due to change in force dependence, a myosin-type slow adaptation modeled as in Shepherd and Corey (19), and a voltage-dependent flick measured from short voltage steps. Four predictions (top left, transduction current I(t); bottom left, bundle movement X(t); top right, peak current-displacement I(X); bottom right, force-displacement F(X)) adequately mimicked the experimentally measured data shown in Fig. 2. (B) Measured motion (solid line) and predicted motion (dashed line) of a bundle during 12-ms-long force steps, with the cell depolarized at 0 ms and repolarized at 6 ms. Data replotted from Fig. 7 C. The model used bundle parameters from the cell of Fig. 7 (listed in Fig. 7 legend). One free parameter—the additional force needed to open a transduction channel when Ca2+ is bound—was determined by fitting the data of Fig 6 C. (C) Modeling of bundle movement evoked by depolarization. The model used to predict responses to force steps at a normal holding potential (Fig. 8 A) could also predict the depolarization-evoked movement and the reversal of its polarity seen with varying force bias. Parameters in Table 1. (D) Time-dependent sensitivity of activation. The instantaneous P(X) curve (solid line) has an activation range of ∼100 nm. If fast adaptation (occurring in 1–2 ms) is included, the P(X) curve (dotted line, calculated as the response to maintained steps of different amplitudes) is ∼1.5-fold less sensitive. With only the slow myosin-dependent process (occurring in 10–30 ms), it is broader (dashed line), and with both processes, it is even broader than with myosin adaptation alone (long dashed line). The sensitivity thus depends on the speed of the stimulus. Parameters used were the averages from six cells.

