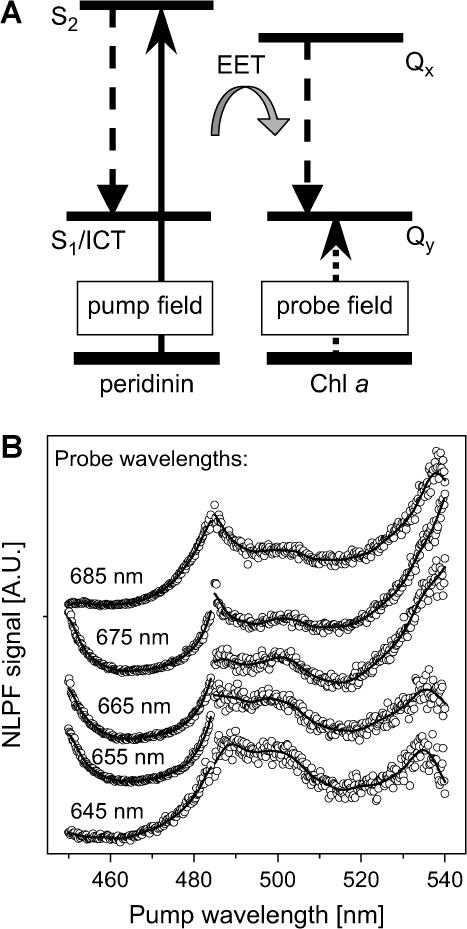
FIGURE 4.
NLPF experiment for subband analysis of the peridinin S2-absorption band in PCP. (A) Schematic: PCP was pumped in the peridinin S2-absorption region and probed in the Chl a Qy region. The shaded arrow symbolizes overall EET from peridinin to Chl a. (B) NLPF spectra for probe wavelengths between 645 and 685 nm (and pump wavelengths in the 450–540 nm region). Note that the spectra are composed of two data sets due to tuning-range limitations of the pump lasers. Solid lines represent smoothed data. Individual NLPF spectra are displaced by a constant, offset for better representation.

