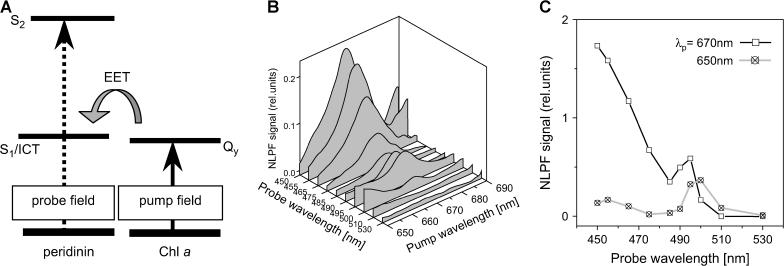
FIGURE 6.
NLPF experiment to elucidate interactions between Chl a and peridinin S1 states. (A) Schematic: PCP was pumped in the Chl a Qy region and probed in the Chl a-Soret/peridinin S2-absorption region. The shaded arrow symbolizes EET from Chl a to peridinin. (B) Quasi-three-dimensional representation of the (smoothed) NLPF spectra. (C) Intensity courses (along the probe wavelength range) of the NLPF signals pumped at ∼670 nm (solid) and 650 nm (shaded).

