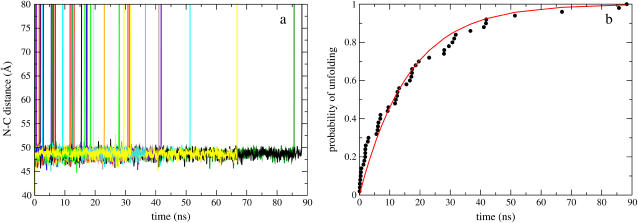
FIGURE 3.
(a) I27 N-C extension as a function of time when a constant 150 pN force is applied using the Gō model. A single unfolding barrier can clearly be seen at 49 ± 2 Å, from which unfolding occurs (N-C distance in the native state is 42 Å). (b) The probability of unfolding fits a single exponential  with τ0 = 16 ns.

