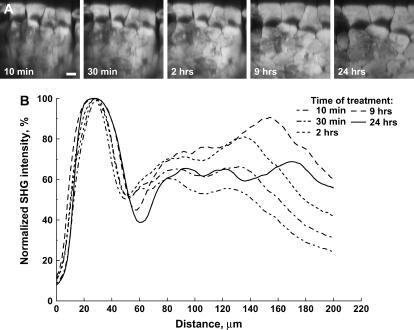
FIGURE 3.
Optical clearing of muscle treated with 100% glycerol. (A) x-z projections of the SHG intensity arising at 10 min, 30 min, 120 min, and 24 h. The muscle fibers are highly swelled at 24 h. (B) The average intensity of each optical section as a function of depth at these time points. Scale bar, 20 microns.

