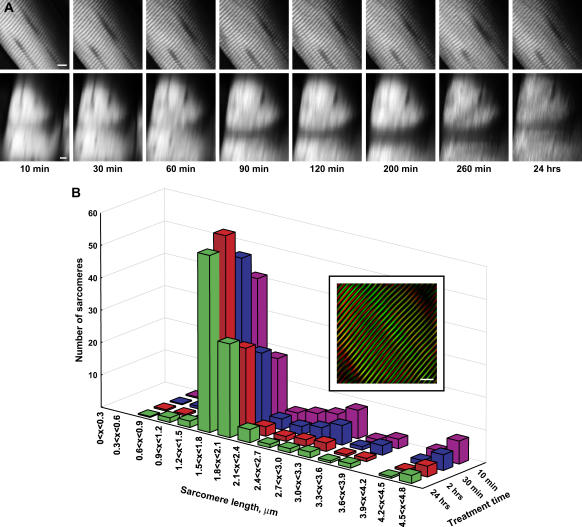
FIGURE 4.
FFT analysis of sarcomere periodicity after treatment with 50% glycerol. (A) The top and bottom panels show one SHG optical section and the corresponding x-z projections during the time course. Scale bar, 5 microns. (B) The power spectra from an FFT analysis of the SHG measurements of the sarcomere periodicity are plotted as histograms for the control and optically cleared tissues. The relative intensities in the two most probable intervals of 1.5 < x < 1.8 and 1.8 < x < 2.1 microns are largely unchanged in these tissues. The less probable intervals at shorter and longer lengths correspond to noise. The inset shows the inverse FFT image calculated for the control and optically cleared tissues based on the two most probable intervals of 1.5 < x < 1.8 and 1.8 < x < 2.1 microns. The green and red data correspond to the FFT-filtered image for the 10 min and 24 h points, respectively.

