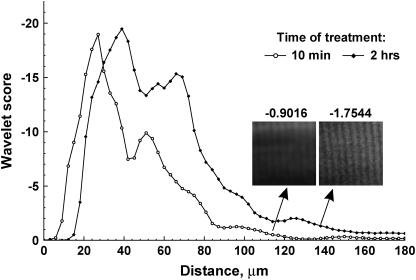
FIGURE 5.
WTEs analysis of image quality after clearing. The absolute WTEs values are plotted as a function of depth for the control and 2 h time points. The entropy values are higher for the optically cleared sample at depths >30 microns. The inset shows two corresponding 50 × 50 pixel image segments from these time points at similar depths which demonstrate the relationship between image quality and WTEs values.

