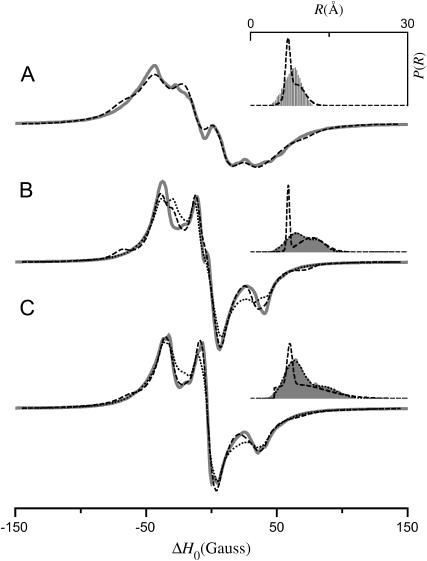
FIGURE 12.
Simulated EPR spectra (gray lines) analyzed using a Fourier convolution method assuming a bimodal Gaussian distribution. The fits obtained by the Fourier convolution method are shown as dashed lines. The insets show the actual distance distribution for the simulated EPR spectrum (gray histogram) and the distance distribution obtained by the Fourier convolution method (dashed line). (A) Same simulation as in Fig. 7 B. (B) Simulation is the sum of those in Figs. 7 B and 9 B. (C) Simulation is the sum of those in Figs. 7 B and 10 B. In the insets to panels B and C the dotted lines were obtained by fitting the histograms to a bimodal Gaussian distribution. The dotted spectra were generated by the Fourier convolution method using these bimodal Gaussian distributions.

