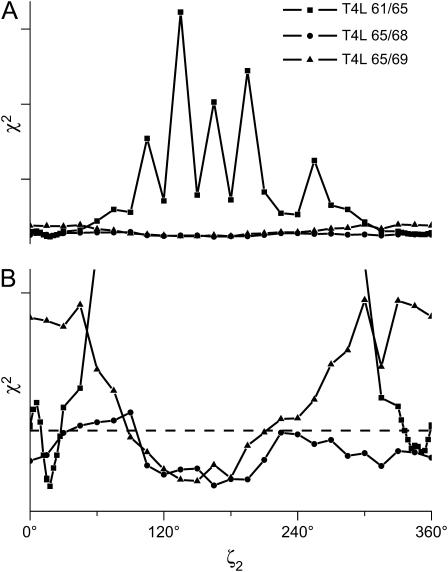
FIGURE 14.
Confidence intervals for ζ2 from the analysis of the spectra of the three spin-labeled double cysteine mutants of T4L using the tether-in-a-cone model. The values of χ2 were obtained by adjusting ψ1, ψ2, and μmax to obtain the best fit to the data at fixed values of ζ2. The top panel shows the results plotted fullscale. The bottom panel shows an expanded scale. In both panels, each curve is scaled to its 99% confidence level calculated using the F-statistic (dashed line). Results are shown for T4L 61/65 (▪), T4L 65/68 (•), and T4L 65/69 (▴).

