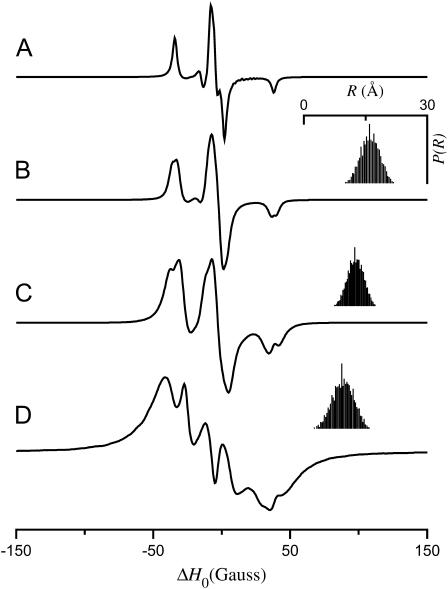
FIGURE 2.
EPR spectra calculated for the tether-in-a-cone model as a function of p. α = β = γ = 0°, ψ1 = 90°, ζ2 = 0°, and ψ2 = 90°. (A) p = 100 Å, q = 0 Å, and μmax = 0°. For all other calculations q = 6 Å; μmax = 30°; and (B) p = 16 Å, (C) p = 12 Å, (D) p = 8 Å. For panels B–D, the insets (top right) show a histogram representing the distance distribution, P(R).

